Financial Stock and Crypto Candlestick Data Charts
Note that currently (AC ver 3.40) the stock data API calls do not work due to a change at the API end point. A fix is on its way although due to the restrictions now imposed by the provider it’s hardly worth fixing!
This is because AC is limited to 25 api calls per day for stock data. Going over this limit the data cannot be shown. Also the stock data returns only the latest 100 data points which is useless for astrology. Fortunately no limitation on calls for Crypto.
When I initially implemented the stock data routine the output was very much more generous. Unfortunately currently the stock routine is not very useful. I’m looking for another free provider.
Please get in touch (email) if you have any thoughts/ideas.
I expect that for stock data I will implement a stock data EOD import routine and remove the API calls completely. This will probably occur after AC iOS 26 implementation for iPad/Mac/iPhone.
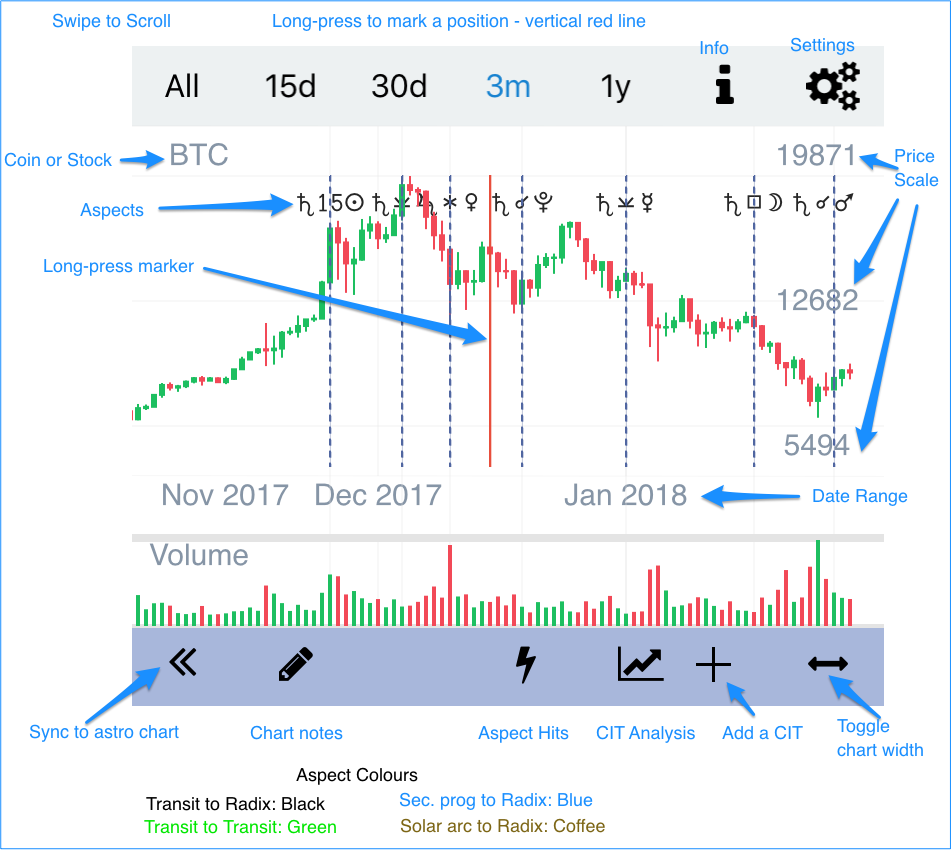
Note that not all screenshots show the new (from ver 1.93) CIT Analysis and Add Cit icons.
From ver 1.93 the date label for long-press over the financial chart is positioned at the top for a clearer view.
Note that if you have Aspect Hits calculated after the current date, ie now the graph will not be able to show any data, ie it will be empty.
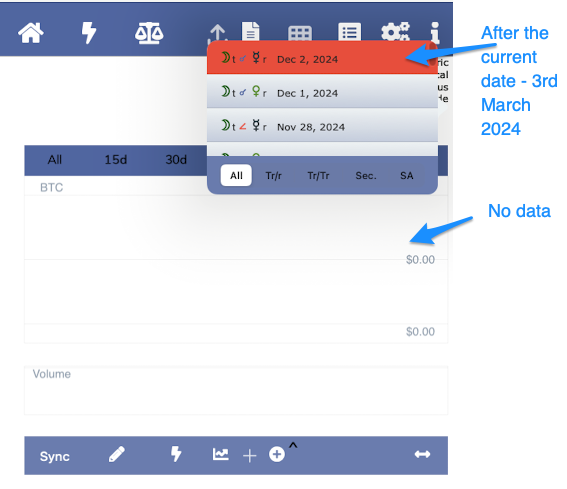
No Data – Finance
Full Landscape
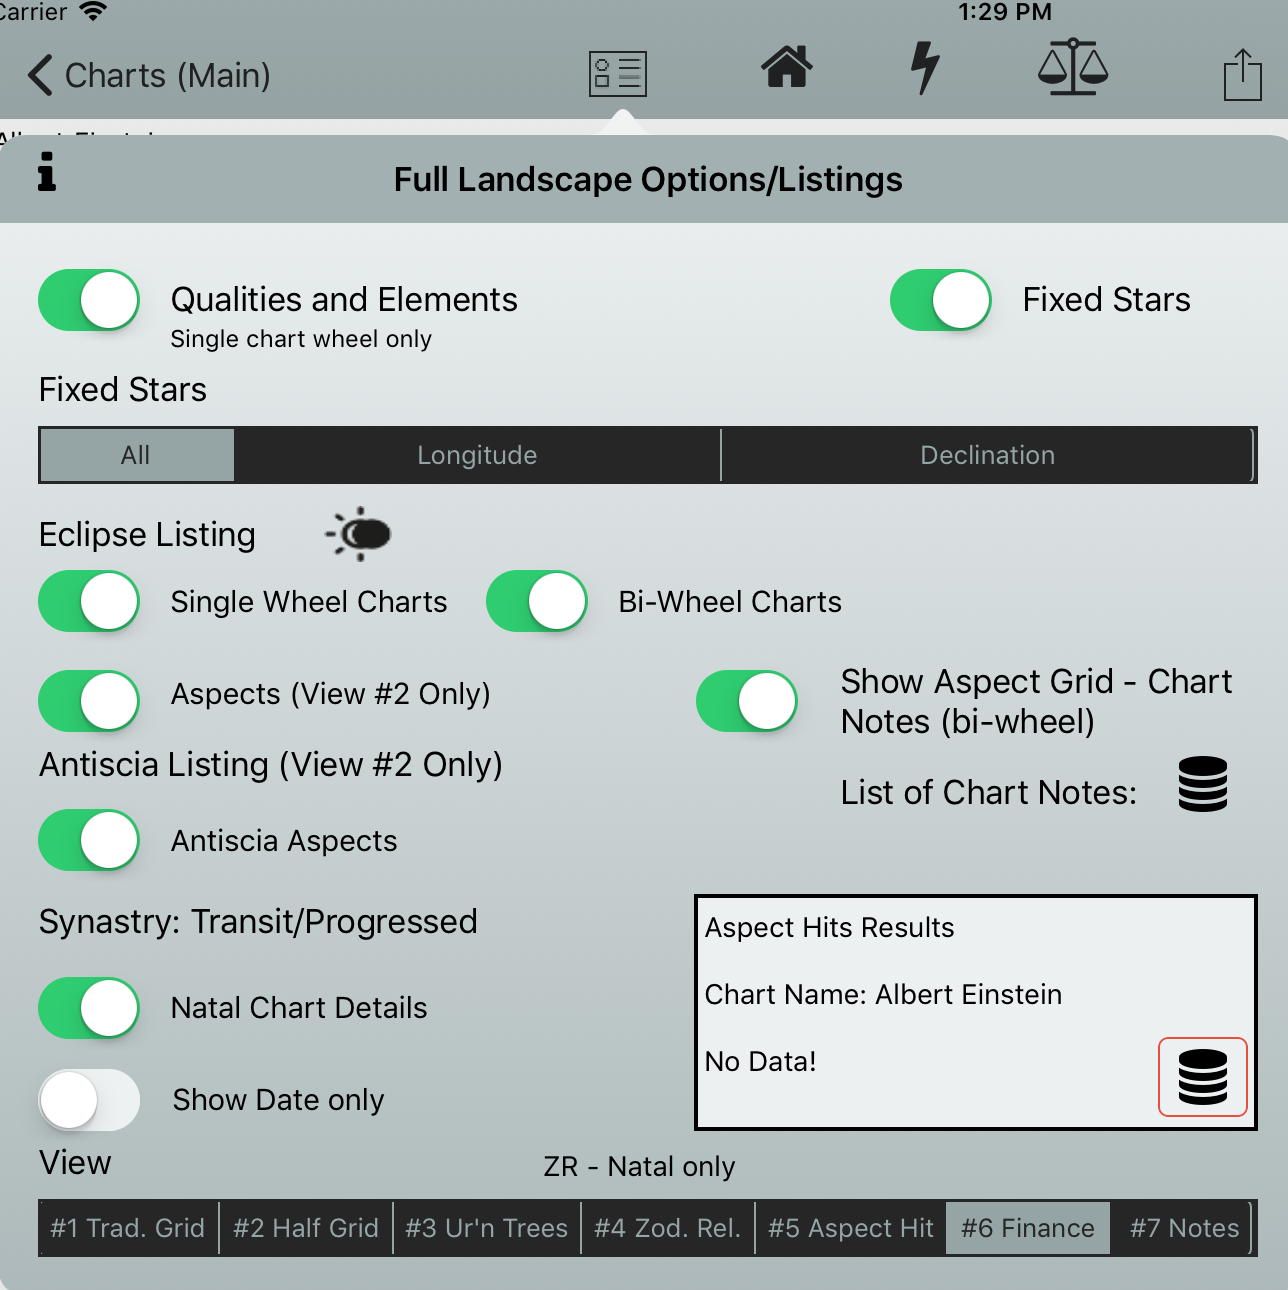
Full Landscape #6 – Finance (including Crypto)
Help
Settings
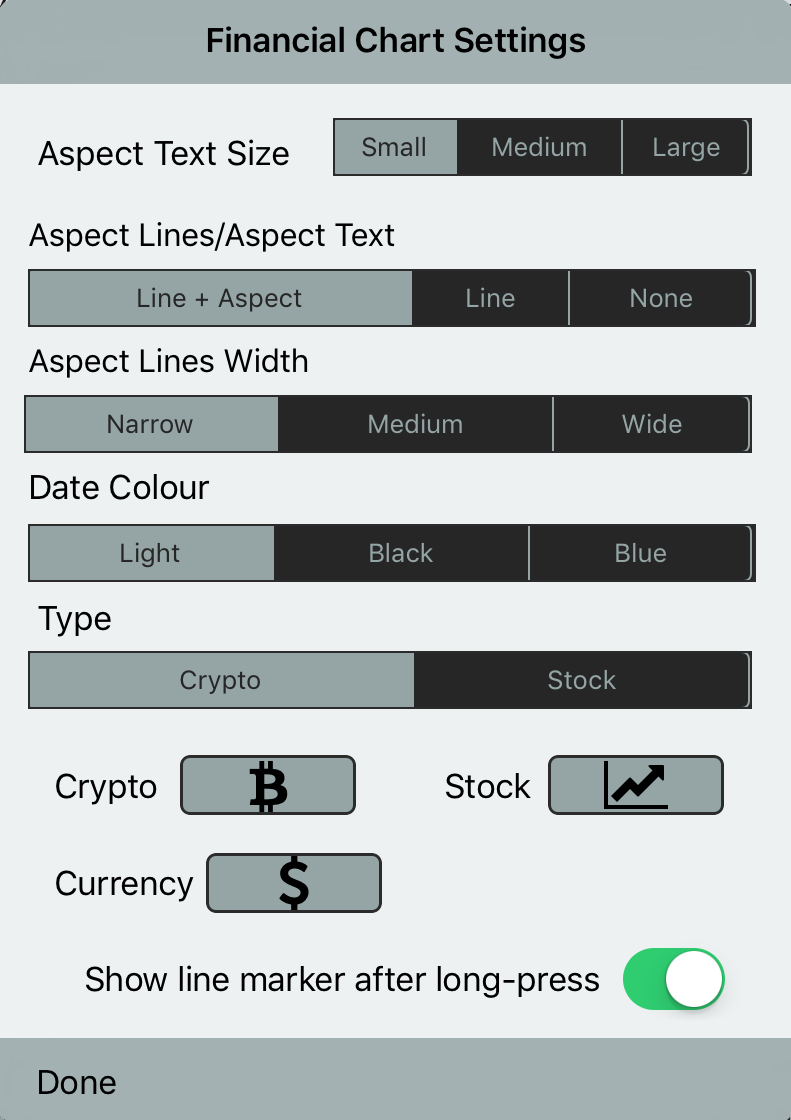
Financial Chart Settings
AC ver 3.21 – Import Financial data button added.
Stock Table
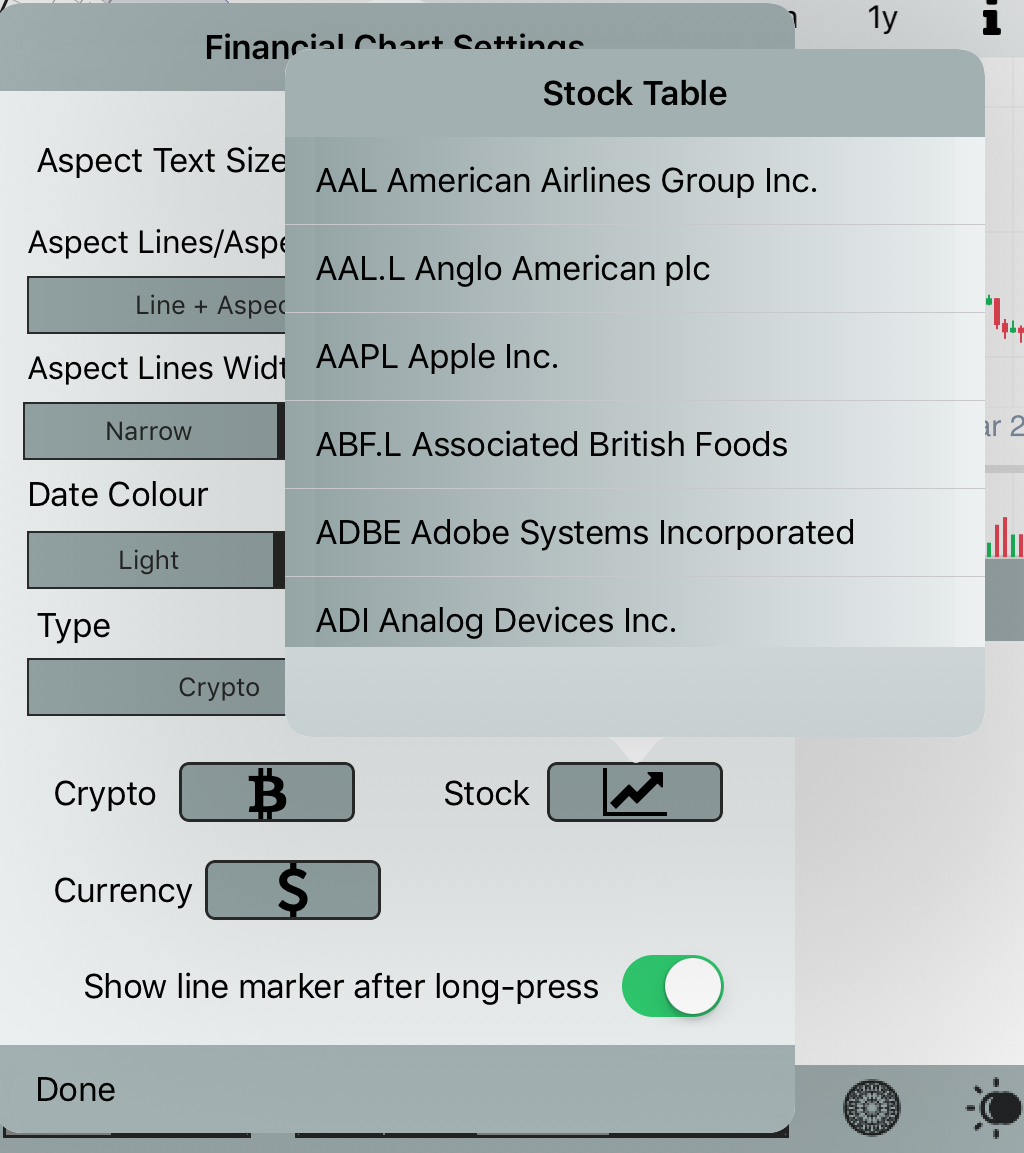
Stock Table: .L are for London Stock exchange, all others for USA
Financial Stock Data – (up to 20 years data – limited to 25 api calls per day). Please note the Remove vertical lines button has been removed/deleted.
CIT Analysis
from AC ver 1.93
Extended Zero values
Extended zero values Crypto data. Useful to see up-and-coming aspect hits.
Layout of Financial Chart menus (Remove not available)
Recent Transiting Aspects – after the Aspect Hit Table has been dismissed. It can be recalled by tapping the Lightning Strike button
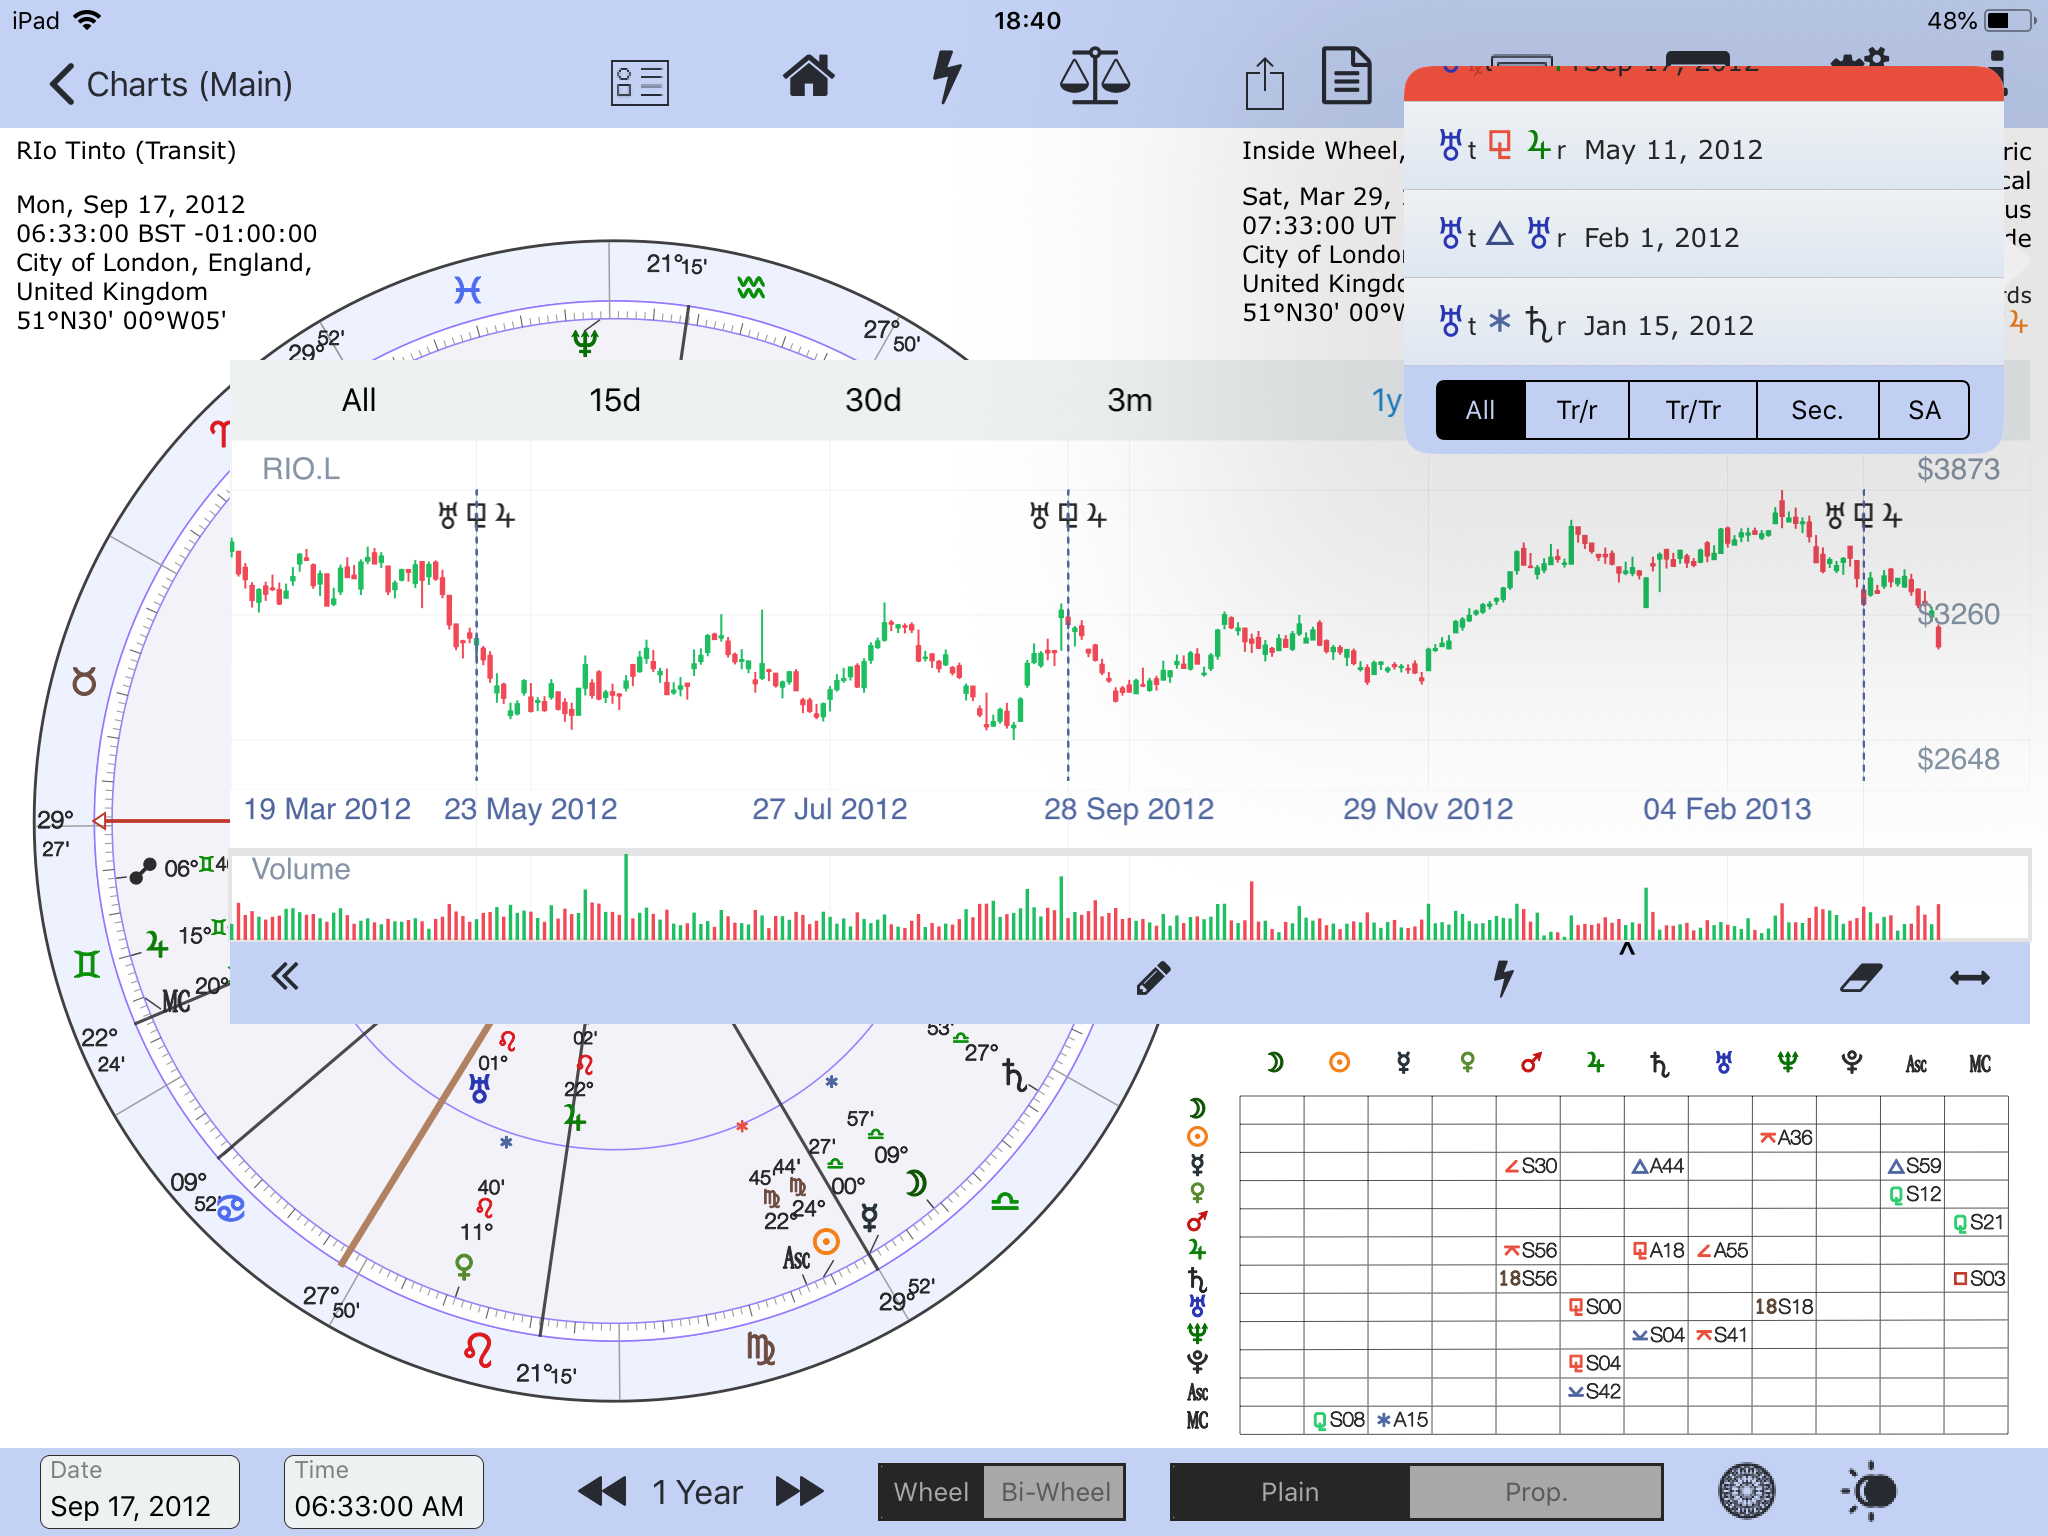
Aspect Hits for Rio Tinto
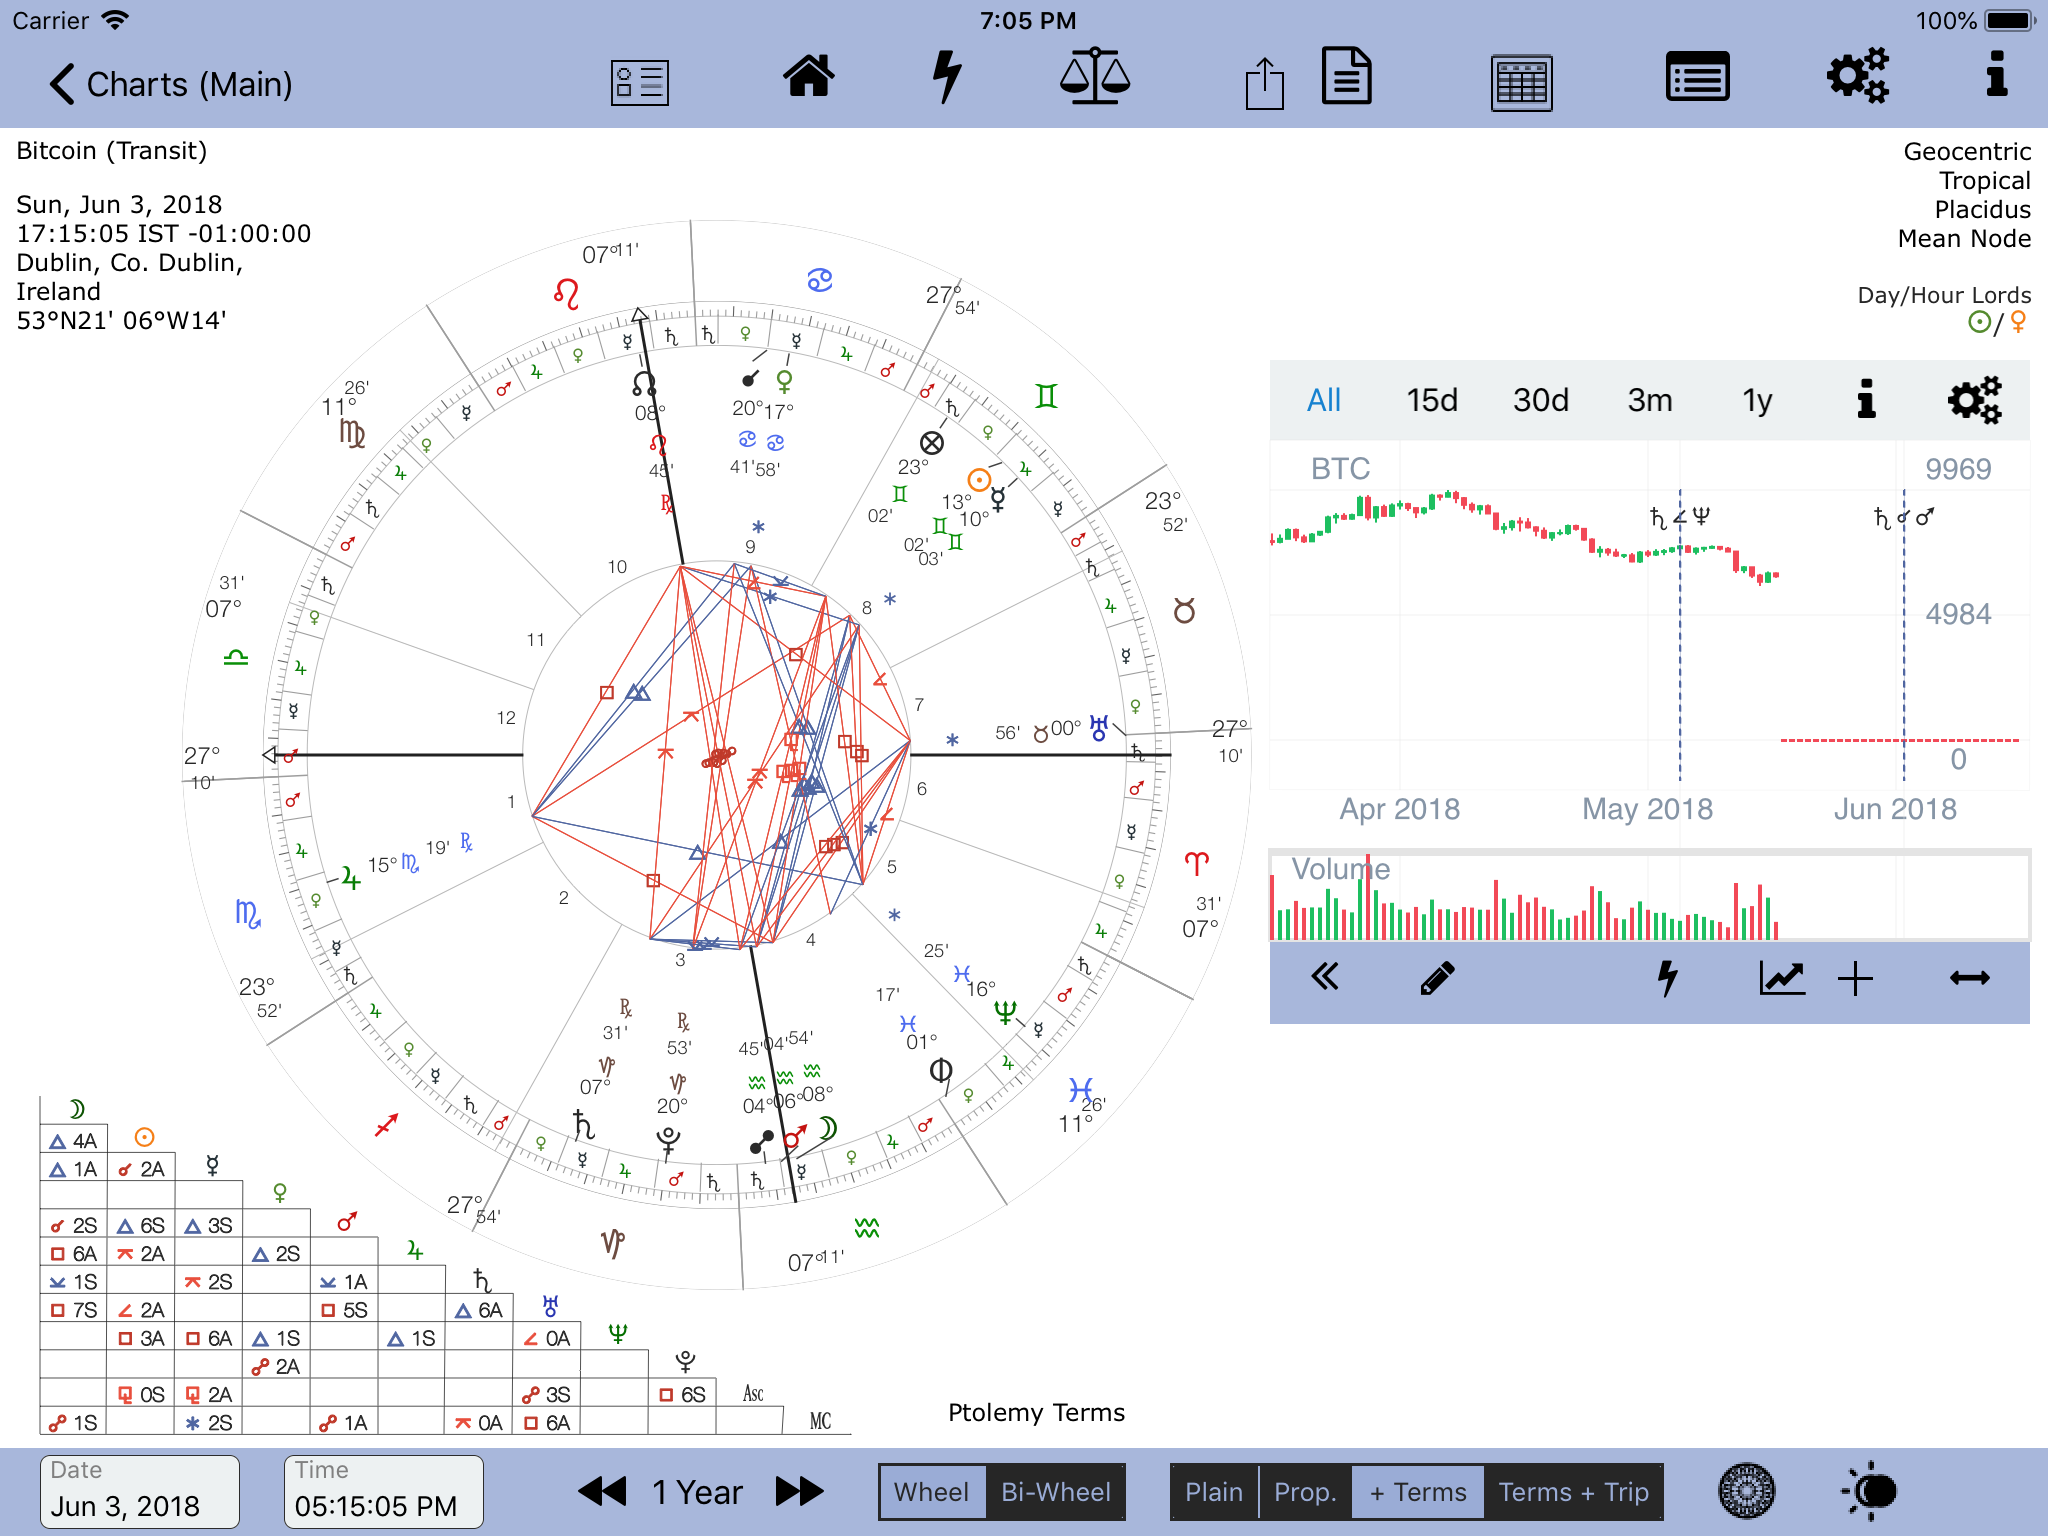
Viewing aspects associated with the Stock/Crypto Data
To view aspects and sync an aspect date with the associated astro chart
- Have an astro chart of the Stock, eg Rio Tinto or crypto data eg Bitcoin
- Create an Aspect Hit table of hits by selecting the Lightning Strike button (top menu) and calculating some aspects. When exiting the Aspect Hit form the calculated aspects to the natal chart are saved. See here for an analysis of Bitcoin:
- Select Full Landscape #6 – Finance, if not already selected.
- Ensure the stock or crypto currency matches the astro chart. Tap Settings (Cogs) to change your data selection – see screenshot: Layout of Financial Chart menus above.
- Tap the Lightning Strike button on the financial chart menu. The Aspect Hit table data is shown (just above the financial chart), and the aspect hits are drawn on the financial data chart – a vertical line and the aspect is shown (depending on the settings, of course). The aspect hit date is automatically sync’d to the astro chart. See the screenshot above: Aspect Hits for Rio Tinto, and the short animated GIF below
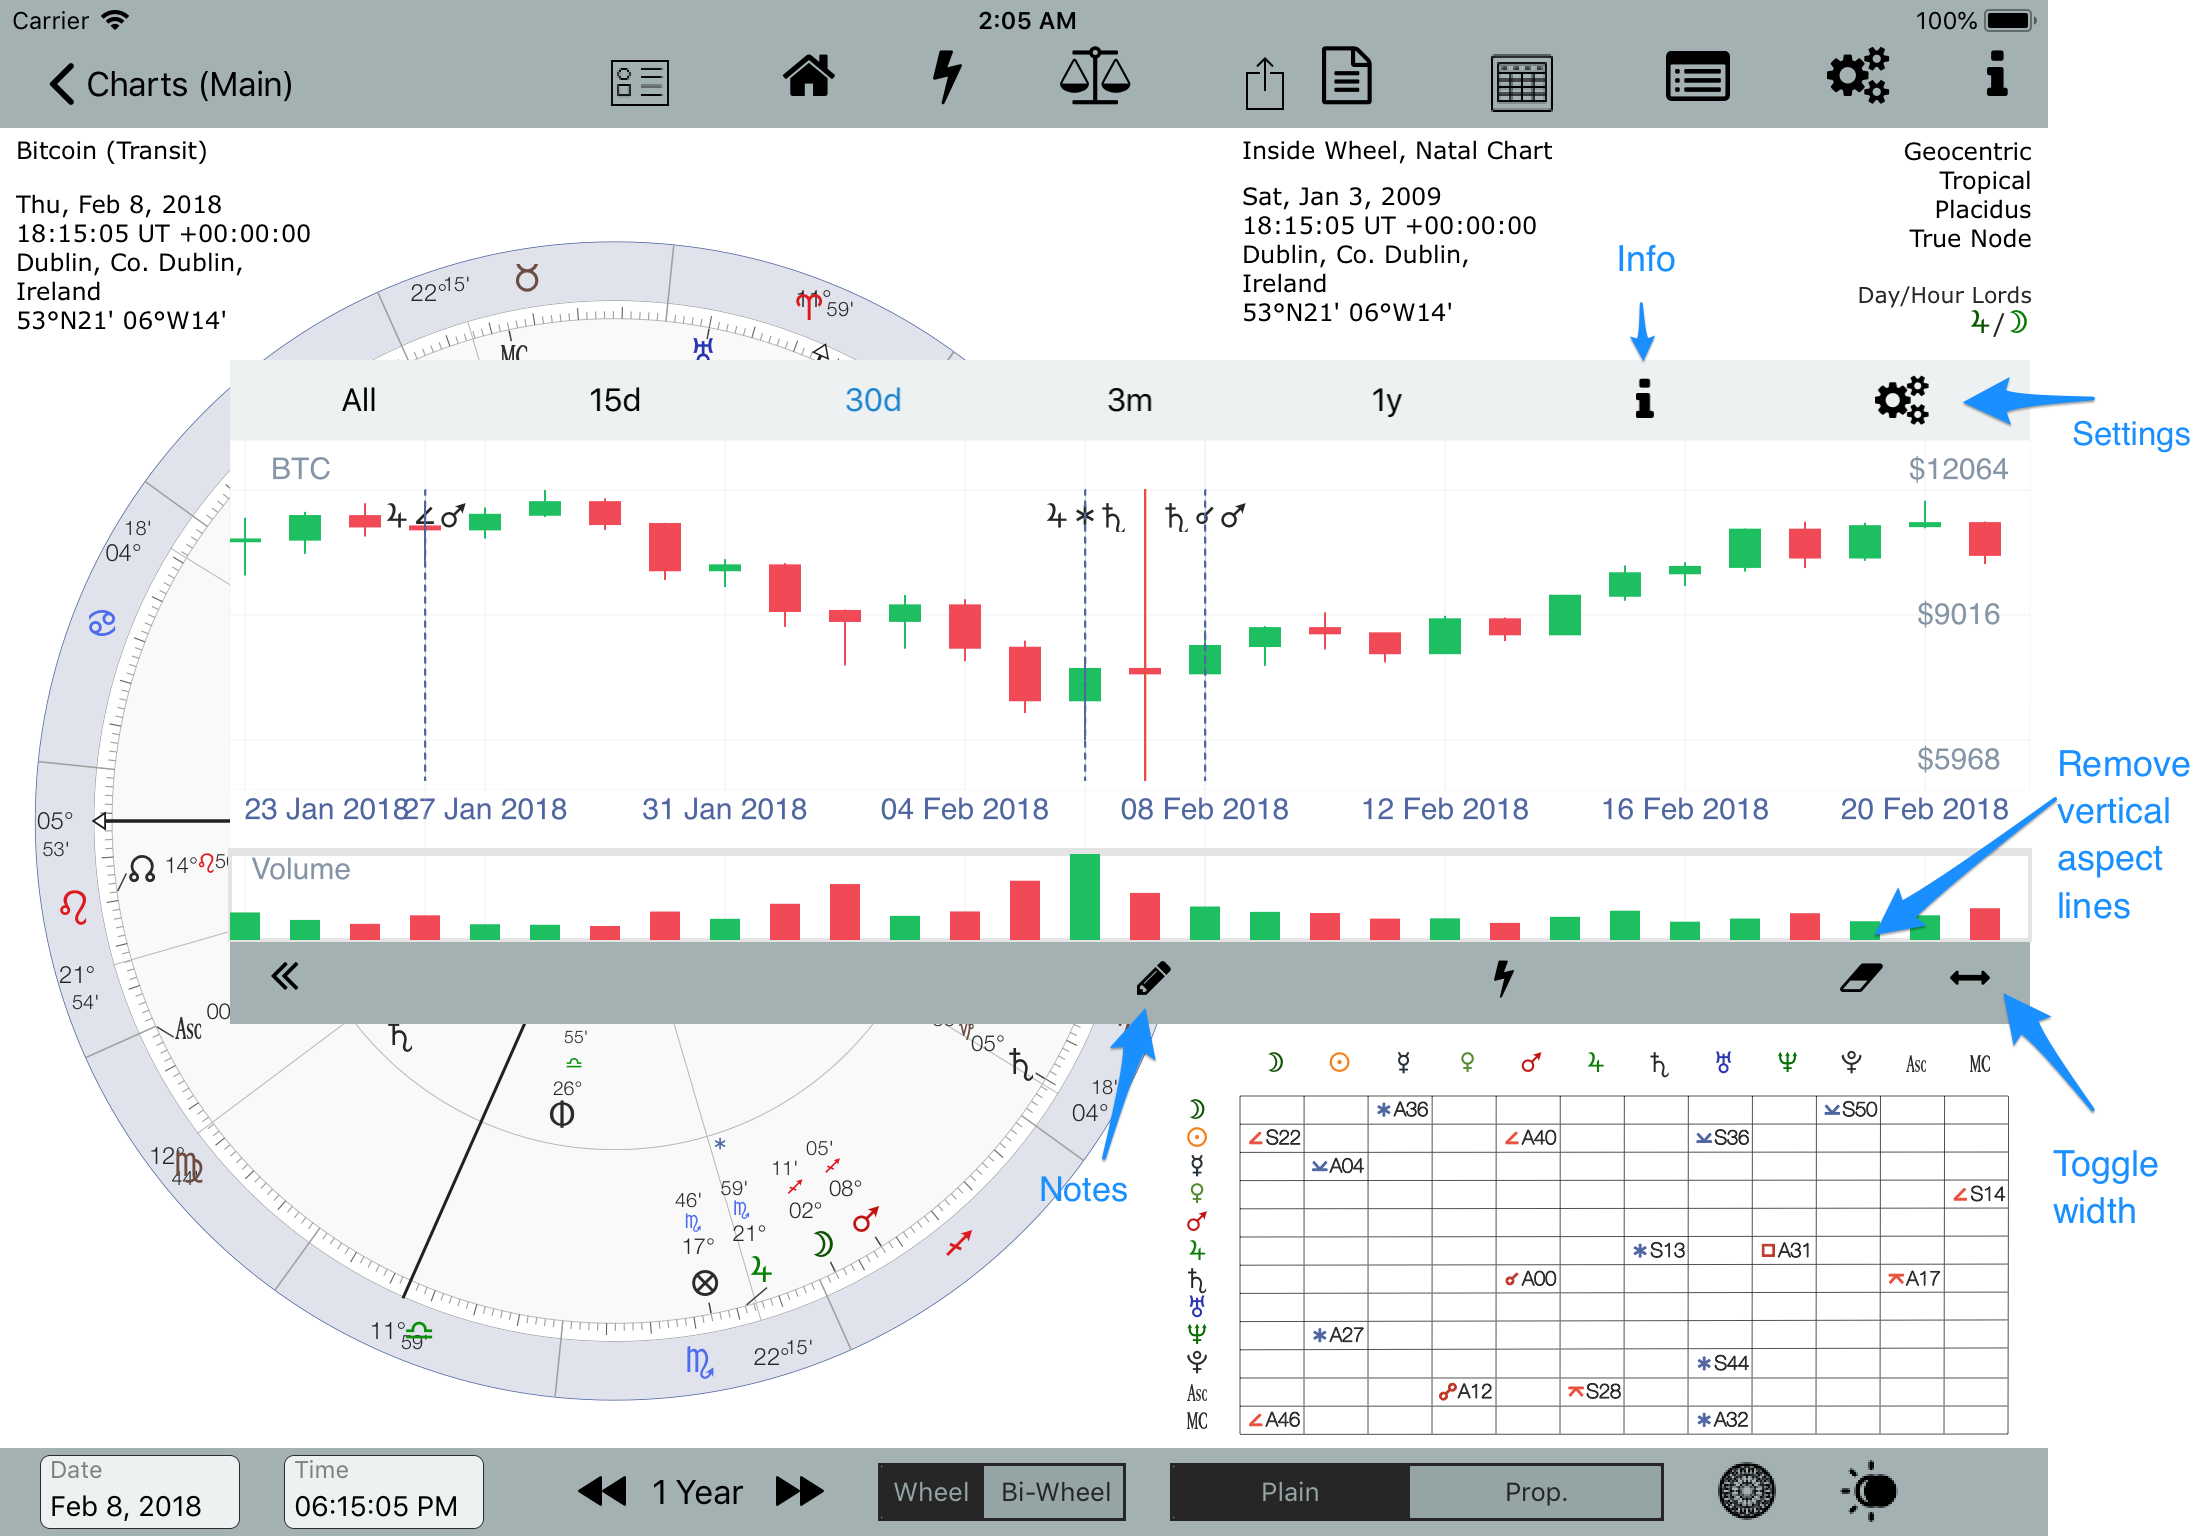
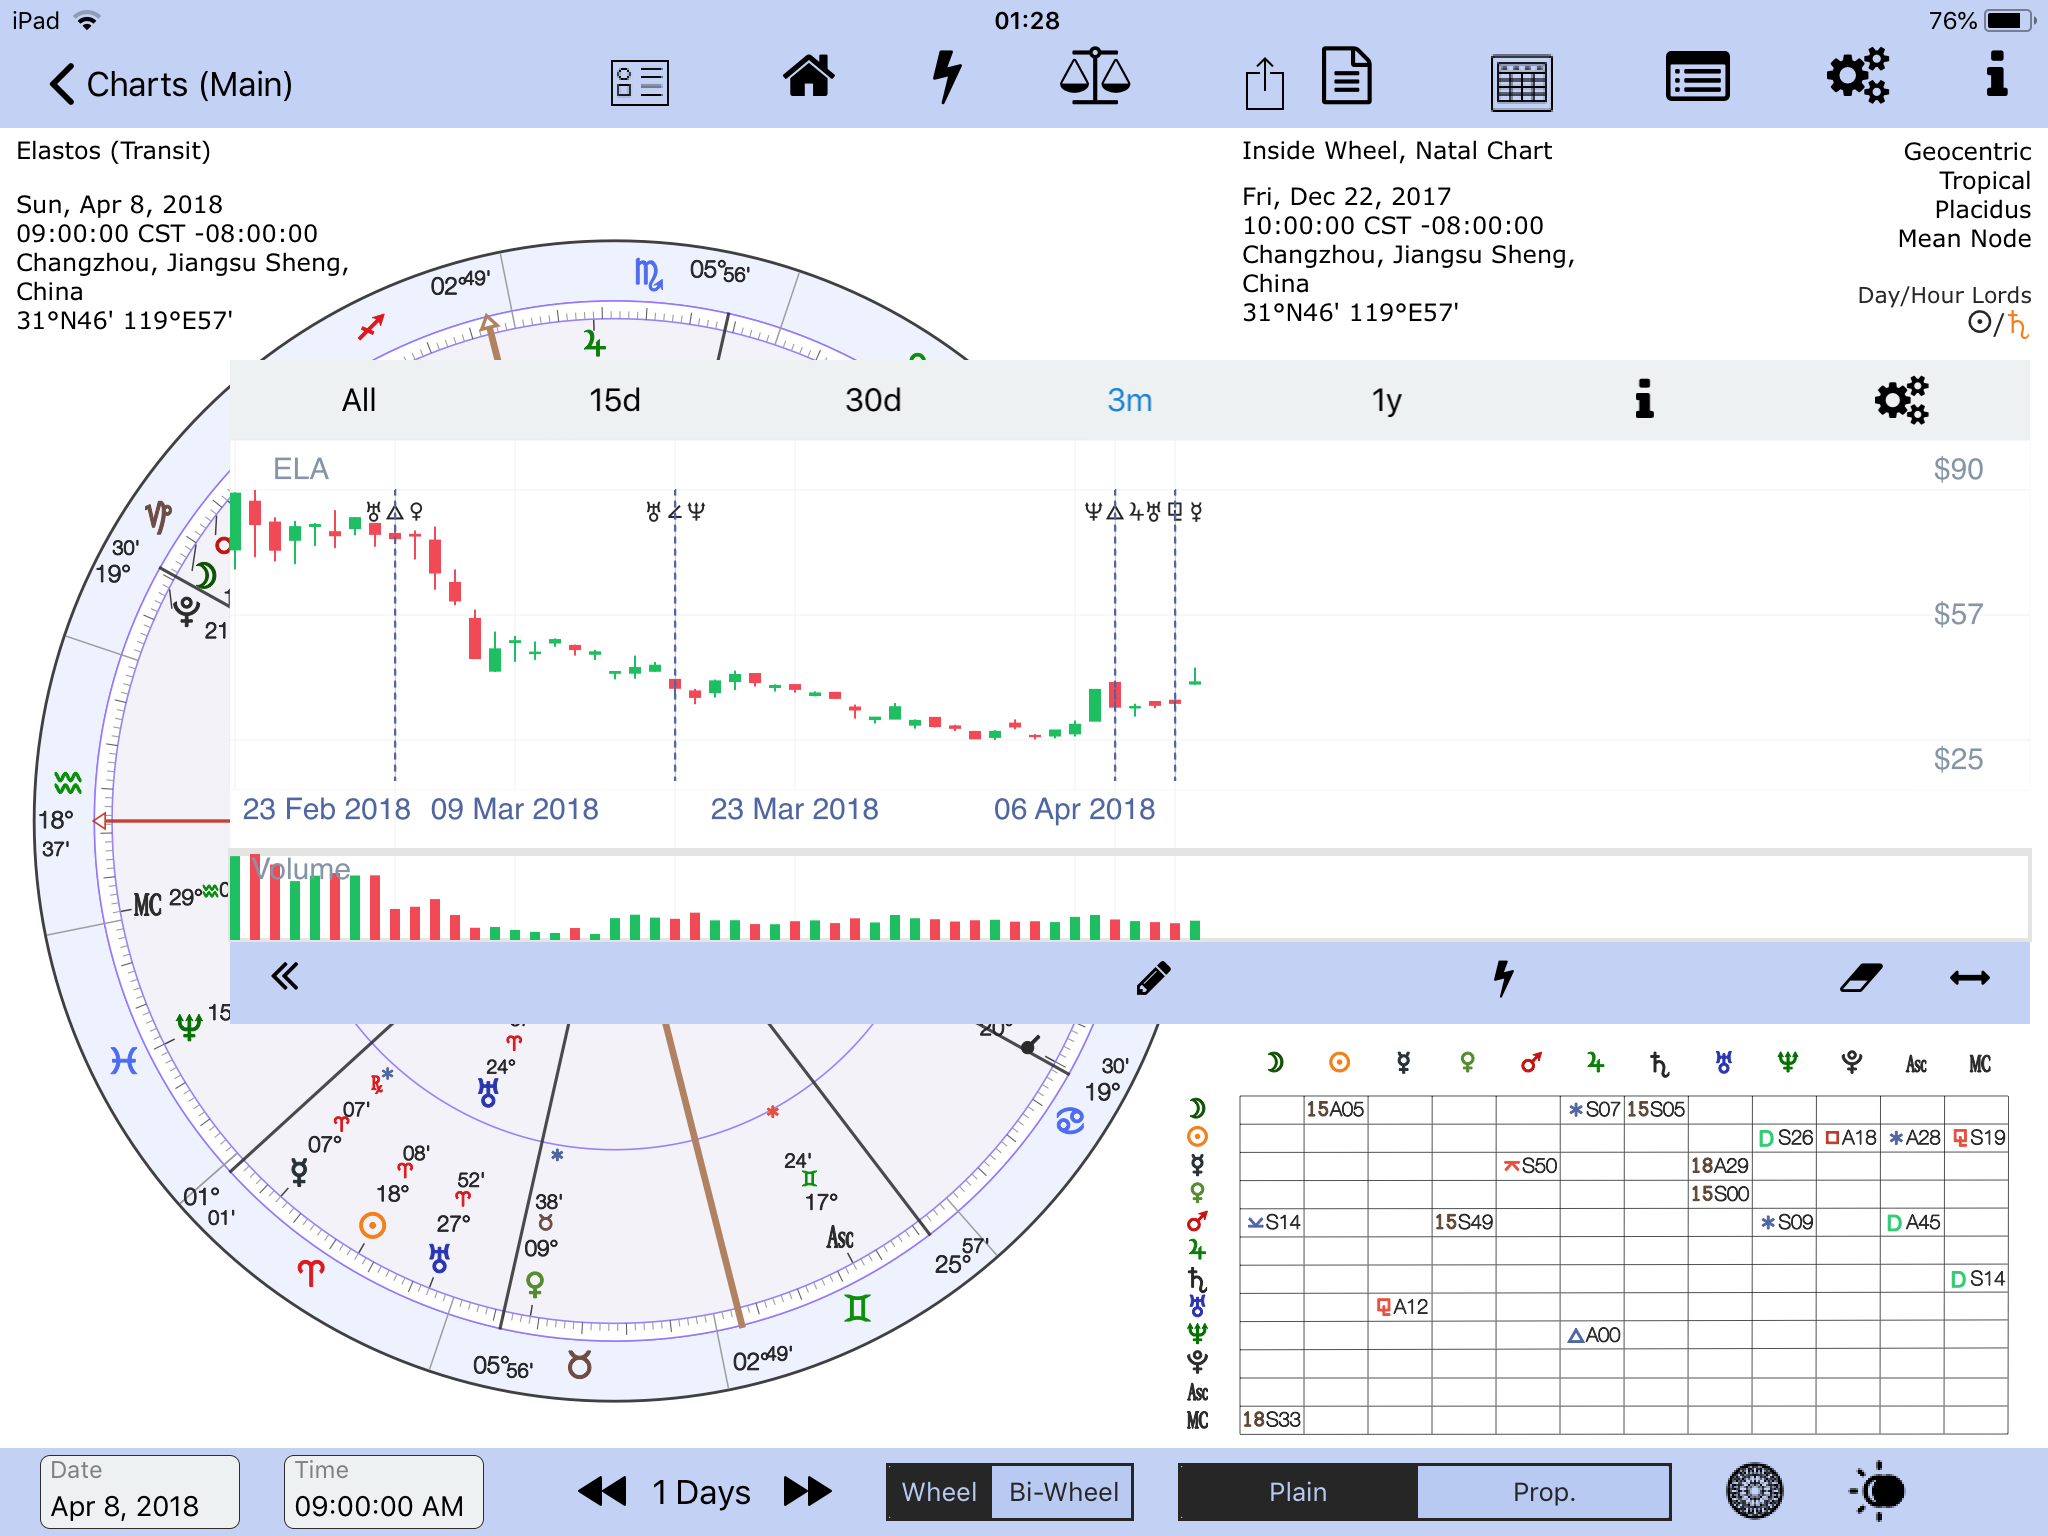
- Tap an aspect in the Aspect Hit table. The financial chart will centre the data (using 30 days) to show the aspect more clearly, and the astro chart will automatically adjust to the date of the aspect. If eg, the aspect is a transit to a radical point, the chart will reflect this by changing (if necessary) to the appropriate bi-wheel. If the aspect is a transit to transit the chart will reflect this by changing (if necessary) to a single-wheel. The aspect grids will change according to the chart’s type, single or bi-wheel. Similarly for Sec. Progs, and SA directions.
- Please note that with a long-press over either aspect grid (single-wheel chart the aspect grid is shown on the left, bi-wheel the aspect grid is shown on the right) the Aspect Table will pop-up which can be useful.

Bitcoin Aspect Hits – Sync to Astro Chart.
Syncing an Astro Chart after a long-press over the Financial chart data

Bitcoin: Sync charts with long-press. First-time requires button to be tapped twice.
Resolving the problem of aspects that occur over a weekend for stock charts
Crypto currencies trade 24/7, stocks trade Monday to Friday, and don’t trade on some public holidays.
What if an astrological aspect occurs on a Saturday or Sunday? A vertical line and the corresponding aspect can not be shown to correspond with the stock data, as there isn’t any. How does AC resolve this dilemma? AC uses a simple algorithm: if an aspect occurs on Saturday or Sunday the aspect is shown as being exact on the Monday and the aspect’s vertical line is drawn to correspond with Mondays data. If no data exists because of say a public holiday and the exchange is shut that day then the aspect will not be shown. When analysing a chart against stock data this should be taken into account.
CIT Analysis
Missing Aspects when there is a significant CIT
Stock First Trade Dates:
Useful Foundation Dates, from Google: